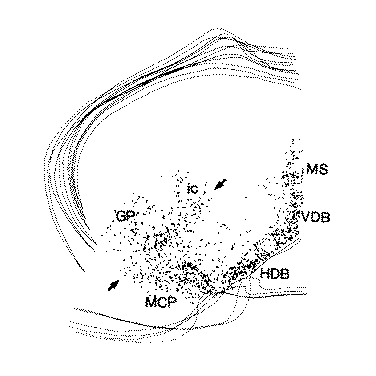
Figure 1.7-.2 Composite map illustrating the distribution of cholinergic pro- jection neurons (dots). This drawing was composed from 6 camera lucida drawings which were aligned and superimposed to generate the final figure. Only the ventral outlines of the brain and the corpus callosum are indicated. The same technique is used to show the distribution of putative contact sites of different afferent systems in relation to the cholinergic neurons in Fig. 15. Cells between the arrows correspond to the area of the SI. Abbrev. See Fig. 1.


