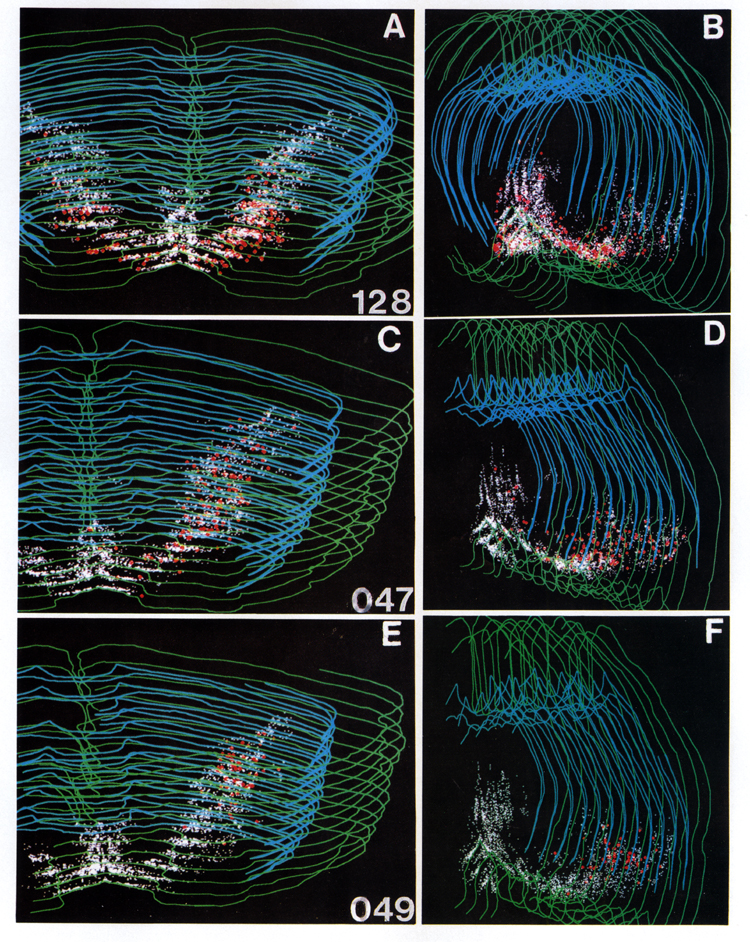
Fig. 7. Computer-assisted
reconstructions of ChAT-immunoreactive neuronal populations of cases 93128 (A,B),
93047 (C, D), and 93049 (E,F). In each image, 12 sections are stacked together.
The 3-D images provide a dorsal (A, C, E) and lateral (B, D, F) frontal view of the sections with
ChAT-positive cells (white dots) and sites of PHA-L-labeled input (red diamonds).