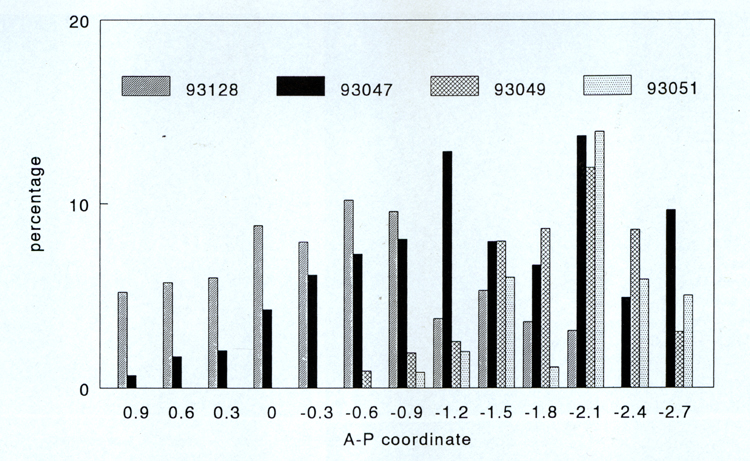
Fig. 8. Histogram showing
the ratio of ChAT-positive cells that may receive PHA-L-labeled input from
ventral midbrain to the total number of ChAT-immunoreactive cells of the BFC at
each level along the anterior-posterior axis. Diagram shows ratios for each of
the four cases (see legend). The x axis shows the A-P coordinates of the
sections related to bregma.