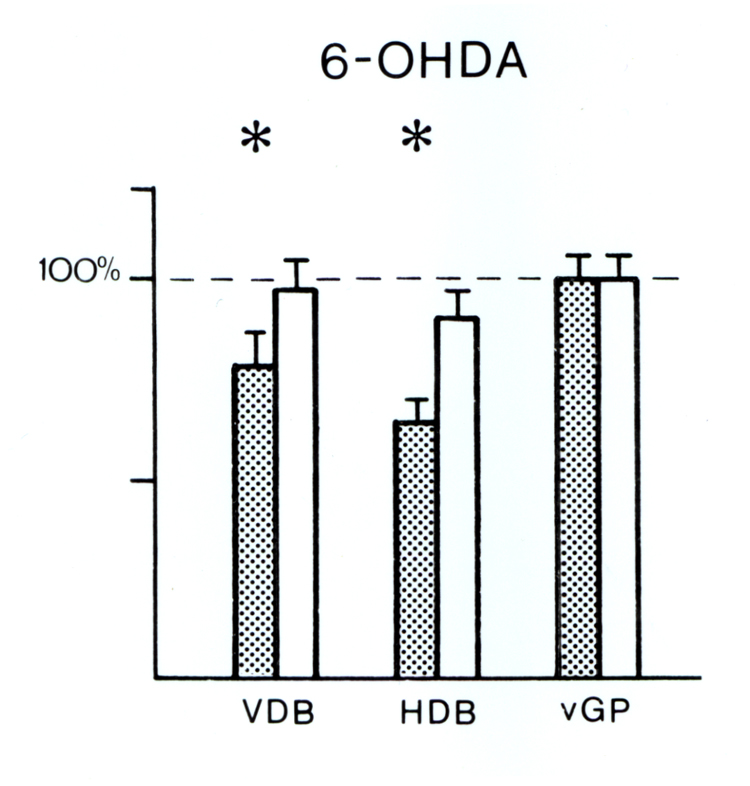
Fig. 11.
ChAT activity in forebrain regions 14 days
after unilateral 6-OHDA injections (10 µg of 6-OHDA dissolved in 4 µl saline
containing 1 mg/ml ascorbic acid) into the ascending catecholaminergic fiber
bundle at the meso-diencephalic border. Values are expressed as percentage of
the corresponding sham injections (vehicle only) where shaded columns are
ipsilateral side and open columns are contralateral side. Maximal in vitro
activity of ChAT was measured radiochemically using [3H]acetyl]-CoA
(Luine and McEwen, l983). Protein was measured according to Bradford et al.
(l976). ChAT activities reflect nmoles ACh produced/mg protein/hr and are mean
+ S.E.M. for determination in 7-8 rats/group from corresponding tissue punches.
Data analyzed by two-way ANOVA and differences between all the groups tested by
Newman-Keuls analysis. * group different from all other groups, at a level
of p 0.05. VDB, vertical limb of the diagonal band; HDB, horizontal limb of the diagonal band; vGP, ventral part of the globus pallidus.