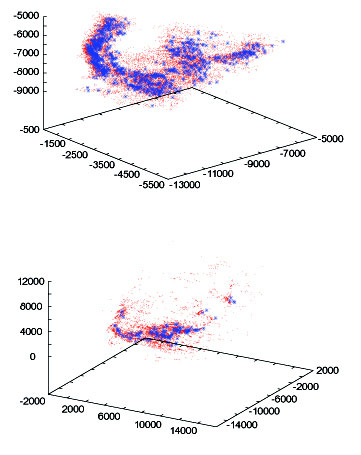
Fig. 2. Scaling of 3-dimensional density distribution of cholinergic cells across species. The total volume in which cholinergic cells are located have been divided both in one rat (upper) (43.5 × 71.8 × 3400 µ) and in one monkey (lower picture) (168 × 163 × 750 µ) into one hundred equal cubes. Red dots represent cubes that contain at least 1 cholinergic cell (total cell number: rat = 15,777; monkey = 5,736). Asterisks symbolize cubes which contain 3-8 cells in the rat and 6-14 neurons in the monkey. These cubes altogether contain the most dense upper 20% of cells in each animal. The number of such cubes in rat (1,773) is much higher than in monkey (153), suggesting that the cholinergic cells in the unit volume of monkey are arranged in more clusters than in the rat. Distances in the coordinate system are in µ. Note the different scaling factor in the two coordinate system. In the monkey (Macaca mulatta) we used an antibody against the low affinity NGF receptor for cholinergic marker, which is colocalized in 90-95% of the cholinergic neurons.