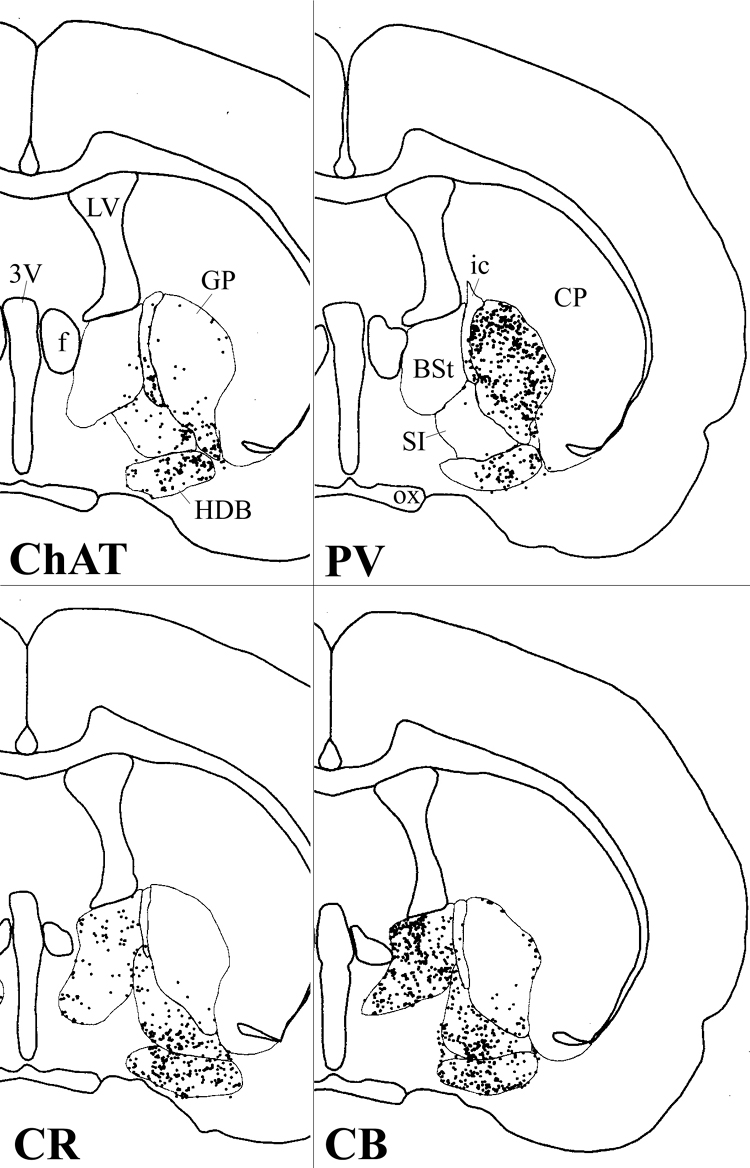
Fig. 3. Distribution of cholinergic (ChAT), parvalbumin (PV), calretinin (CR) and calbindin (CB) containing neurons in adjacent sections, alternately stained for these four markers. Each dot represents one cell body. The approximate distances of the sections from the bregma are indicated in parentheses: ChAT (-0.82 mm); PV (0.88mm); CR (-0.76 mm) and CB (-0.69 mm).