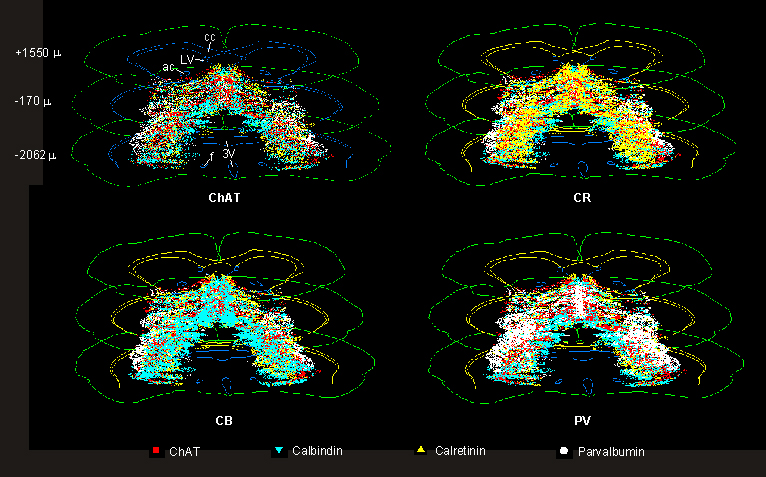
Fig. 5. Three-dimensional spatial relational distribution of ChAT, PV, CR and CB cells in the basal forebrain. The viewpoint of the model is from below and most of the outlines are removed for clarity. The three sections with their approximate location to the bregma is for orientation. Because the symbols representing the different cell types are not-transparent, in order to appreciate their real position, the four models show four different renderings, placing one type of symbol on the top.